01 /
Built automatically.
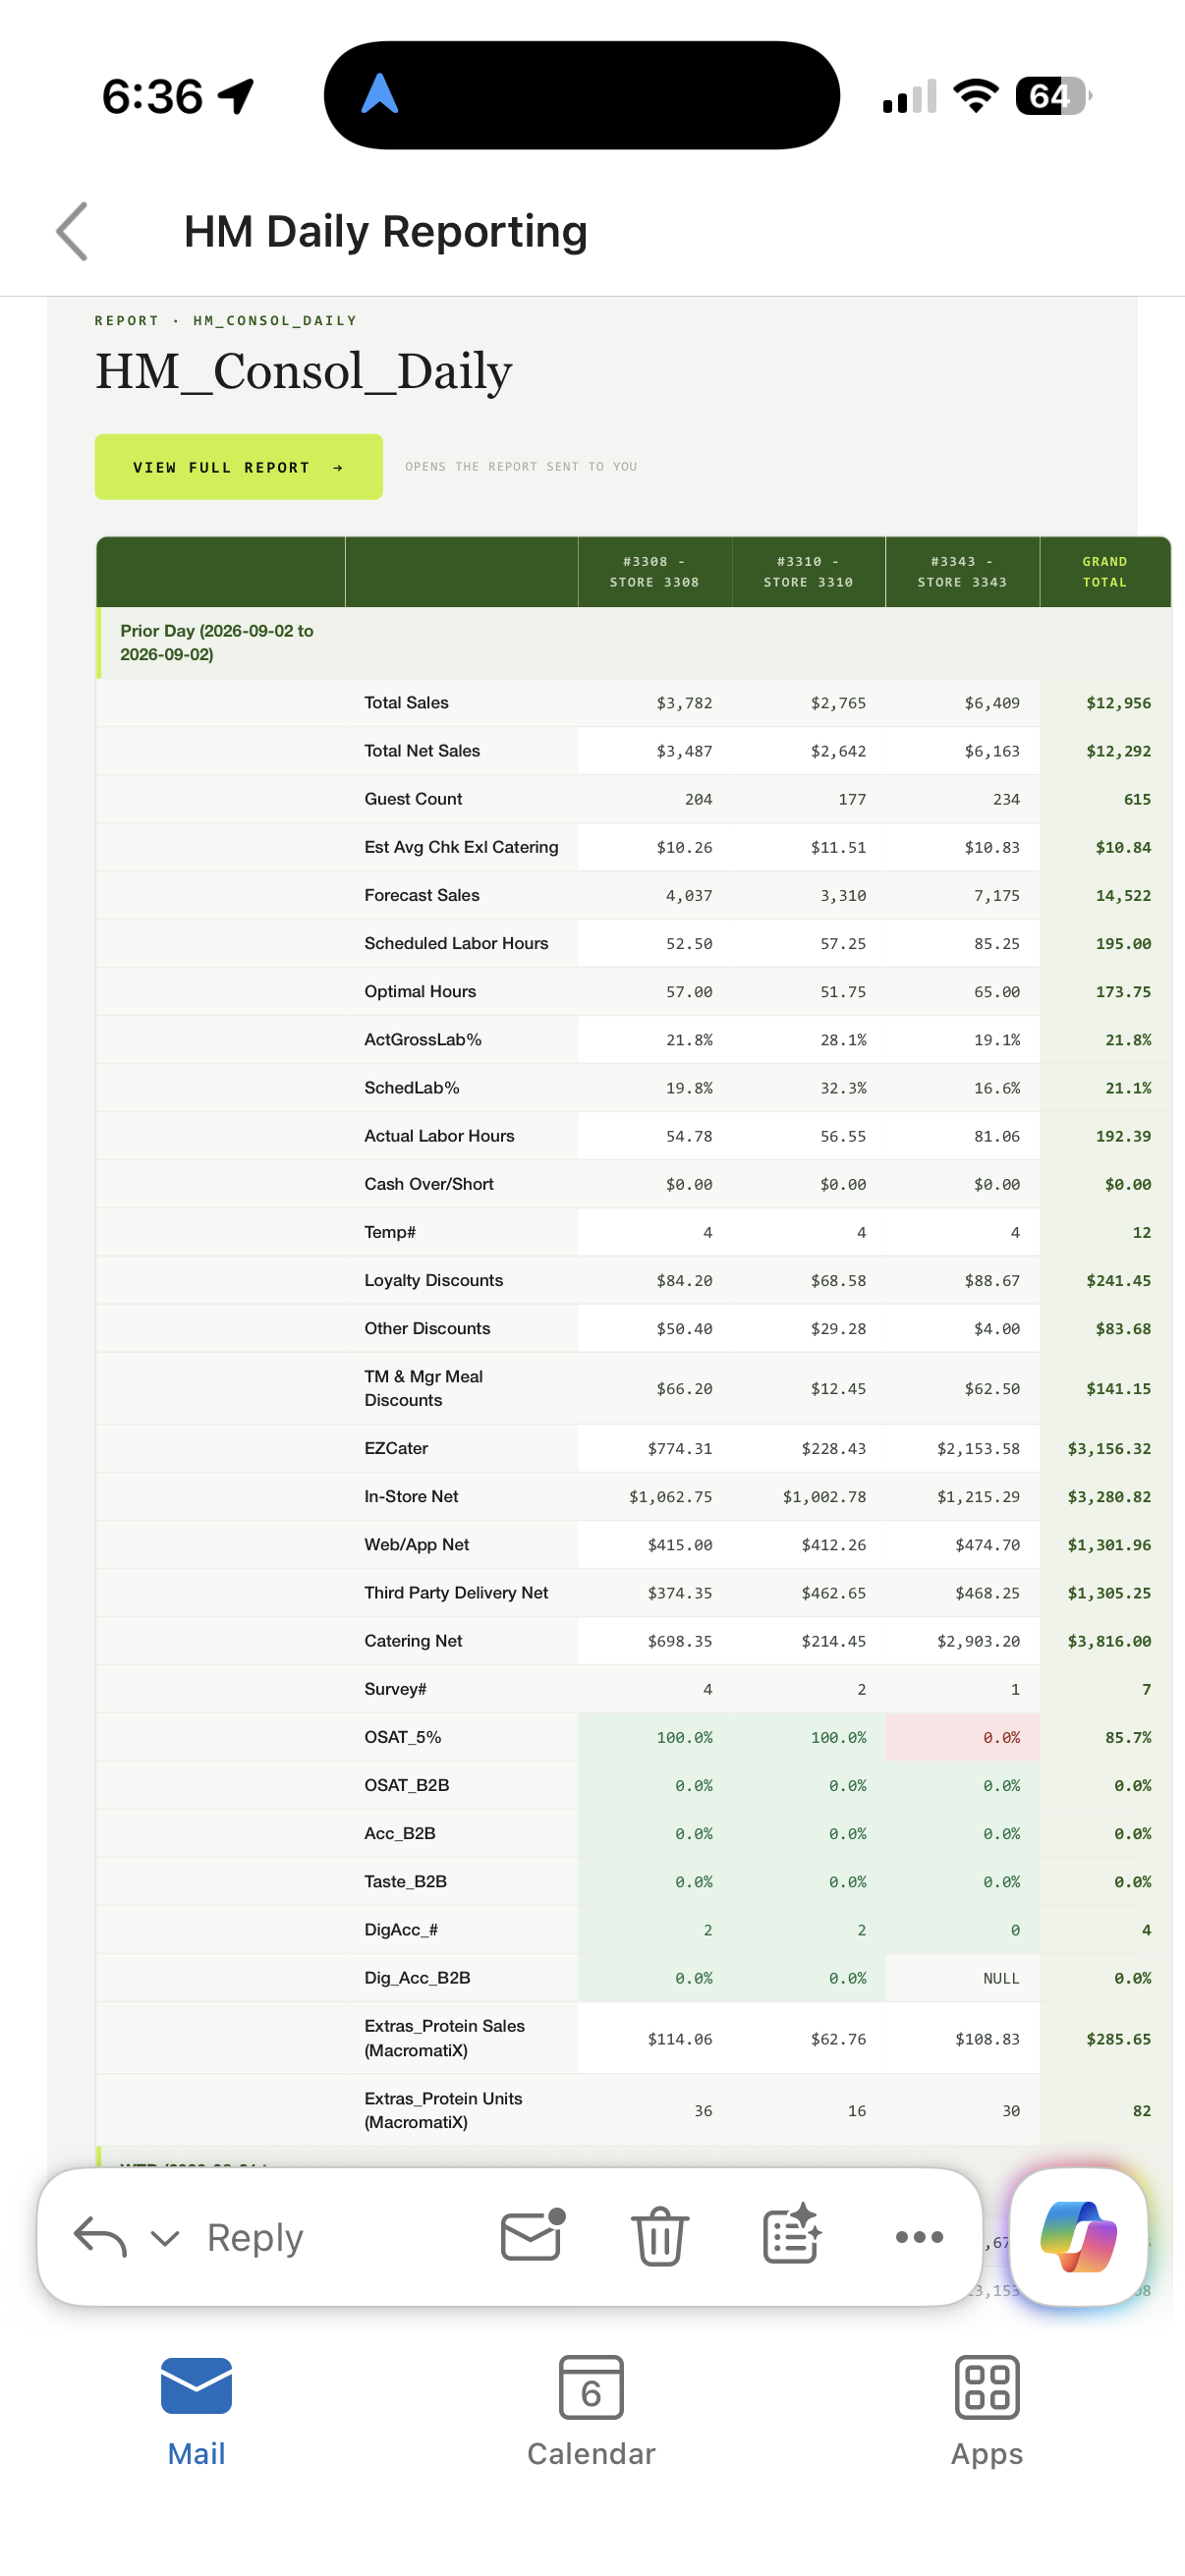
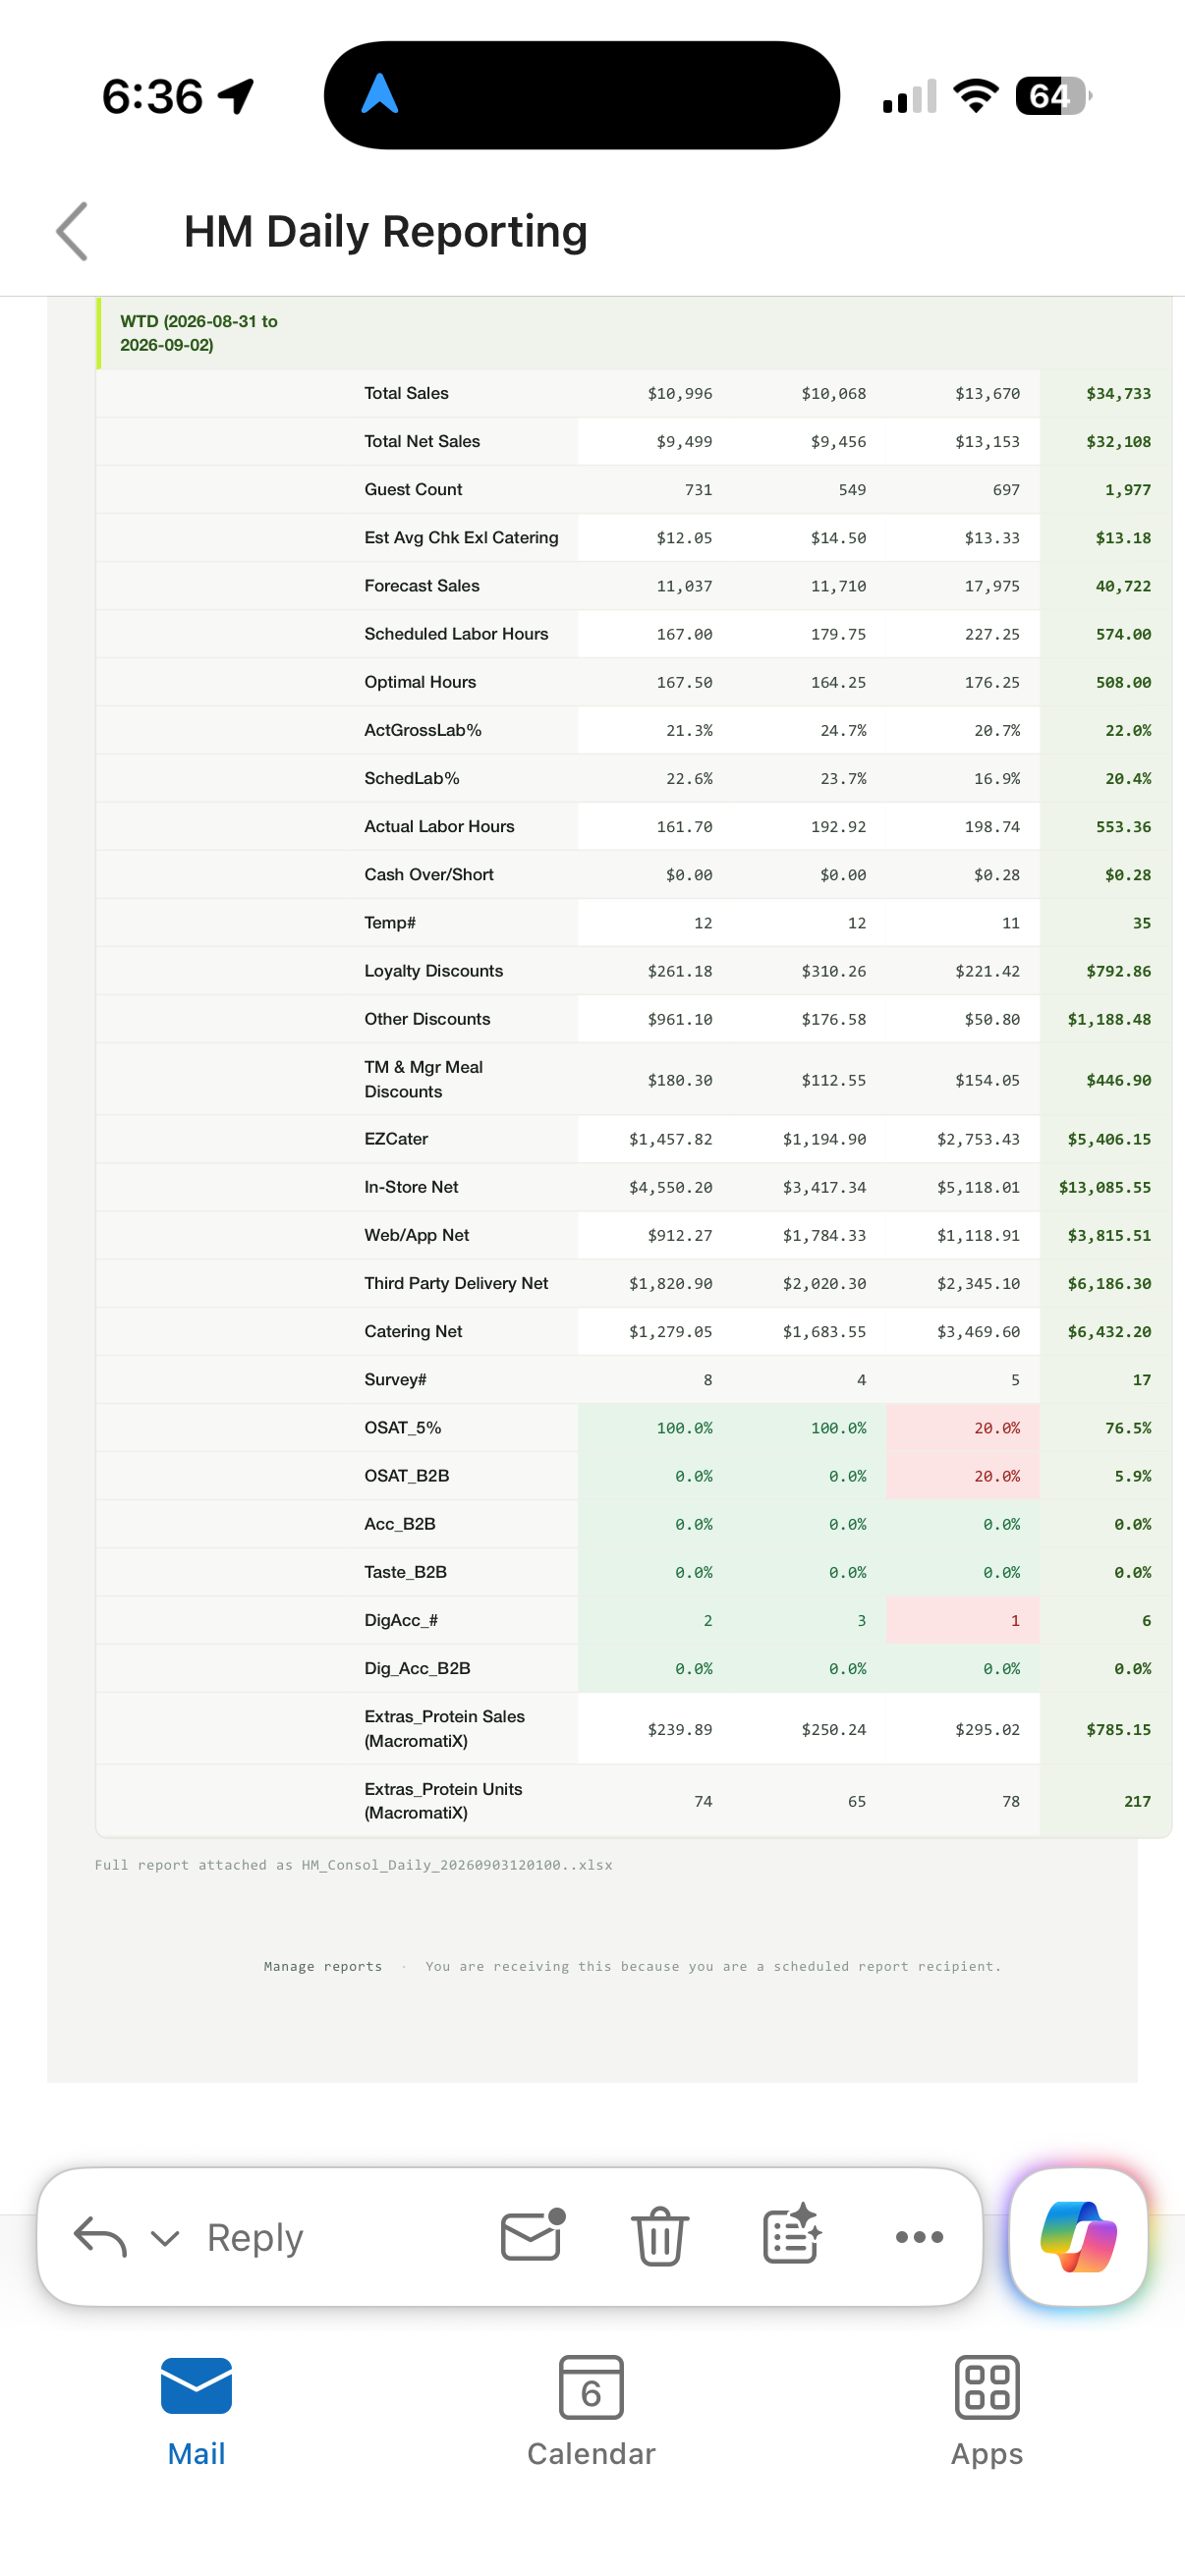
Daily, weekly and monthly reports. Calculated and assembled from connected operating data.
Savnt automates data collection, centralization and report delivery across the different systems your stores use.
Sales, labor, guest feedback, temperatures. Brought together and sent to your teams. The spreadsheet relay can retire.
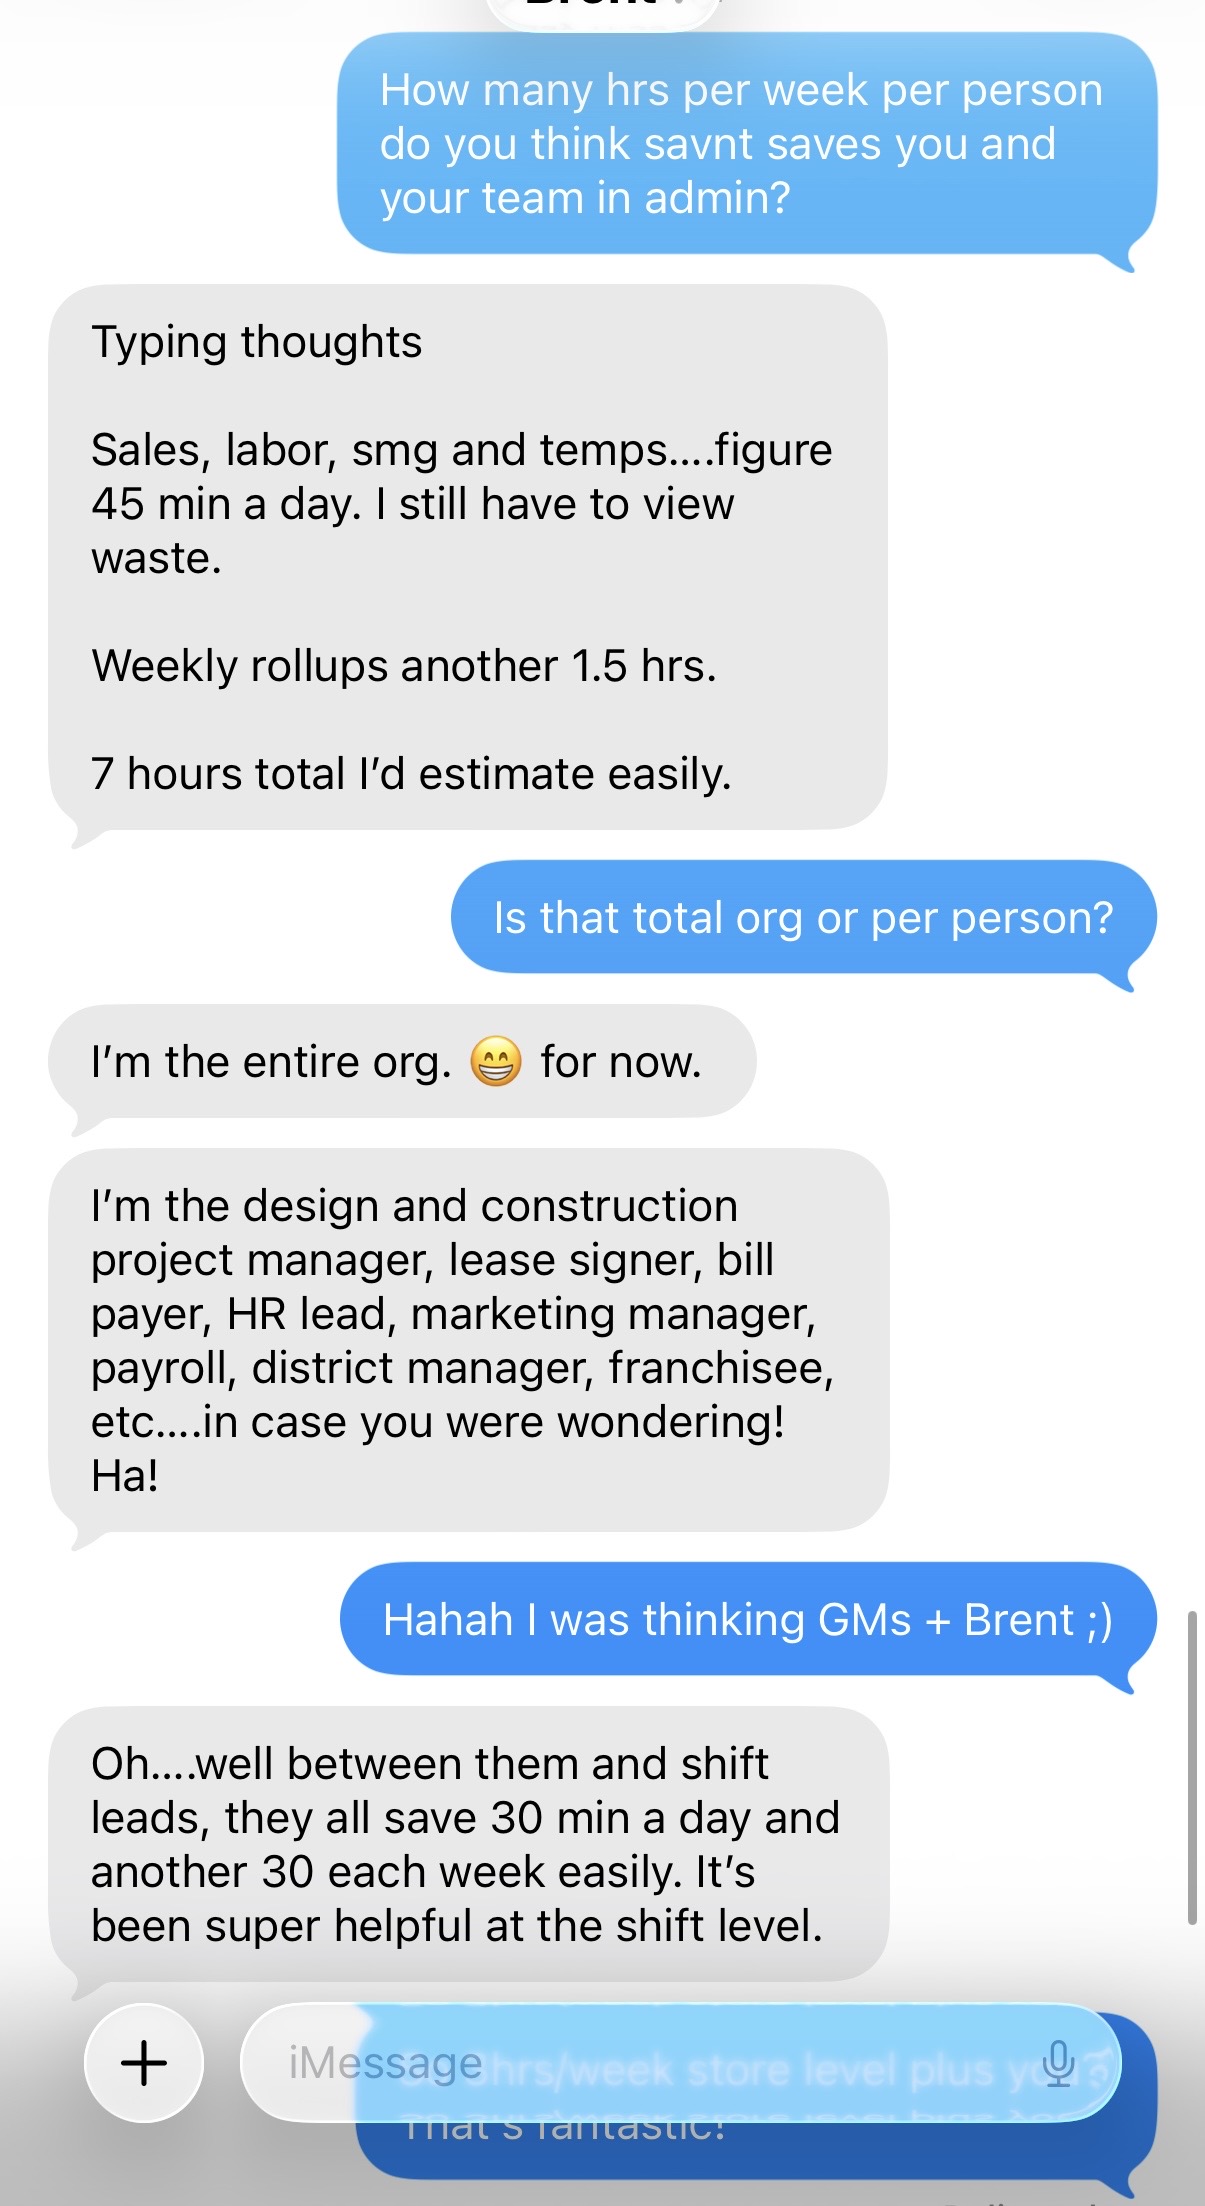
One customer’s estimate of the admin time Savnt removes today. And that’s just the reporting. We haven’t even gotten to the tools that help turn better execution into better margins.
Estimated time saved for each store-level manager and shift leader.
Additional estimated weekly time saved for each of those store-level operators.
Estimated personal time saved by the customer across sales, labor, guest feedback, temperatures and weekly rollups.
One operating view, from the shift leader to the leadership team.
Daily, weekly and monthly reports. Calculated and assembled from connected operating data.
Reports arrive by email and stay available in Savnt, including on mobile.
Store detail for managers. Multi-unit comparisons for operators. Rollups for leadership.
Rank stores, compare results and see who is setting the pace—and who needs attention.
Yes, bragging rights count.Turn an operating goal into a team challenge with visible standings and progress.
Give “do better” a finish line.Track bonus-program performance and measure results automatically against the goals you set.
Less bonus math. Clearer stakes.AI needs to know your operation before it starts offering opinions.
That is why the data foundation matters. Jessica offers an emerging way to ask questions of it today. Deeper explanation, proactive direction and behavioral coaching are where we’re headed.
Know the score across the operation.
Ask Jessica about the data. Deeper explanations of why performance changes are still ahead.
Recommend what to do next, before someone has to ask.
Guide the day-to-day behaviors behind better results.
Carry out approved actions within limits the operator controls.
The one nobody wants to build. Show us what goes into it. We’ll show you what Savnt can take off your plate.
Let us prove it →Savnt automates data collection, centralization and report delivery across the different systems your stores use.
We’re looking for one anchor franchisor to help build the next layer, starting with a central pricing library, modeled pricing and franchisee self-service.
Different markets. Different economics. The next layer connects those differences to the decisions your system makes every week.
Proposed tools to build with our founding partner. The data and reporting foundation is in use today; the capabilities below are the roadmap we would prioritize and validate together.
Give the brand and its franchisees a shared place to manage prices, model changes and see where there’s room to improve.
Maintain item prices by tier, market and effective date, with history intact. Make local differences visible and check register prices against each operator’s chosen tier.
Test proposed item and tier prices against actual sales volumes and menu mix. Compare pro forma revenue by store and cohort, with volume assumptions explicit.
Let franchisees explore their own pricing scenarios and permitted anonymous peer benchmarks. Give them the evidence to assess their opportunity and choose their next move.
Pair each store’s sales history with local weather and nearby events, from game days and concerts to festivals. Deliver a Wednesday planning forecast, refine it Sunday night, and flag material day-ahead changes while managers can still adjust.
Model weather and events together, including how they interact. Calibrate store by store and develop adjusted forecasts and comps with confidence ranges, keeping raw comps visible for comparison.
Build peer groups around market, format, maturity, competition and seasonality. Compare pricing headroom, forecast demand patterns and evaluate sites against stores with relevant similarities.
Give franchisees their own results and permitted anonymous benchmarks. Keep peer identities, membership lists and private financials behind defined access rules.
Reprice the same sales mix at a common base tier to compare food-cost percentages and labor productivity across markets. Keep actual results alongside the normalized view.
Bring item names, pack sizes, units and recipe costs onto a common basis. Connect purchasing, mix, pricing and usage to explain why food cost moved.
Start with an address. Build its market profile from demographics, college proximity, competition and drive-time access. Match it to comparable stores in your system.
Use those stores’ operating results to inform sales and food-cost ranges, seasonality and site assumptions. Put occupancy costs beside the operating picture before committing to the location.
Separate same-store sales movement into price, mix and traffic. Then plan at store, cohort and system level with the assumptions and uncertainty visible.
As the models develop, add market context, weather and event signals, then compare each forecast with what actually happened. Give leadership a plan it can examine and operators direction they can use.
The first partner helps set the priorities, workflows and measures of success.
Bring an engaged sponsor, the people who do the work, and a representative group of stores. Together, we choose a useful first problem and prove the answer.
Choose one or two high-value workflows. Agree on scope and what a successful pilot must deliver.
Define data access, franchisee privacy and decision rights before expanding across the system.
Test with a bounded group, learn with your team and expand what earns its place.
Bring us the problem your team keeps working around. We’ll turn the workaround into a solution Savnt runs automatically.
Start the conversation